Know Your Real Profits.
In Real Time.
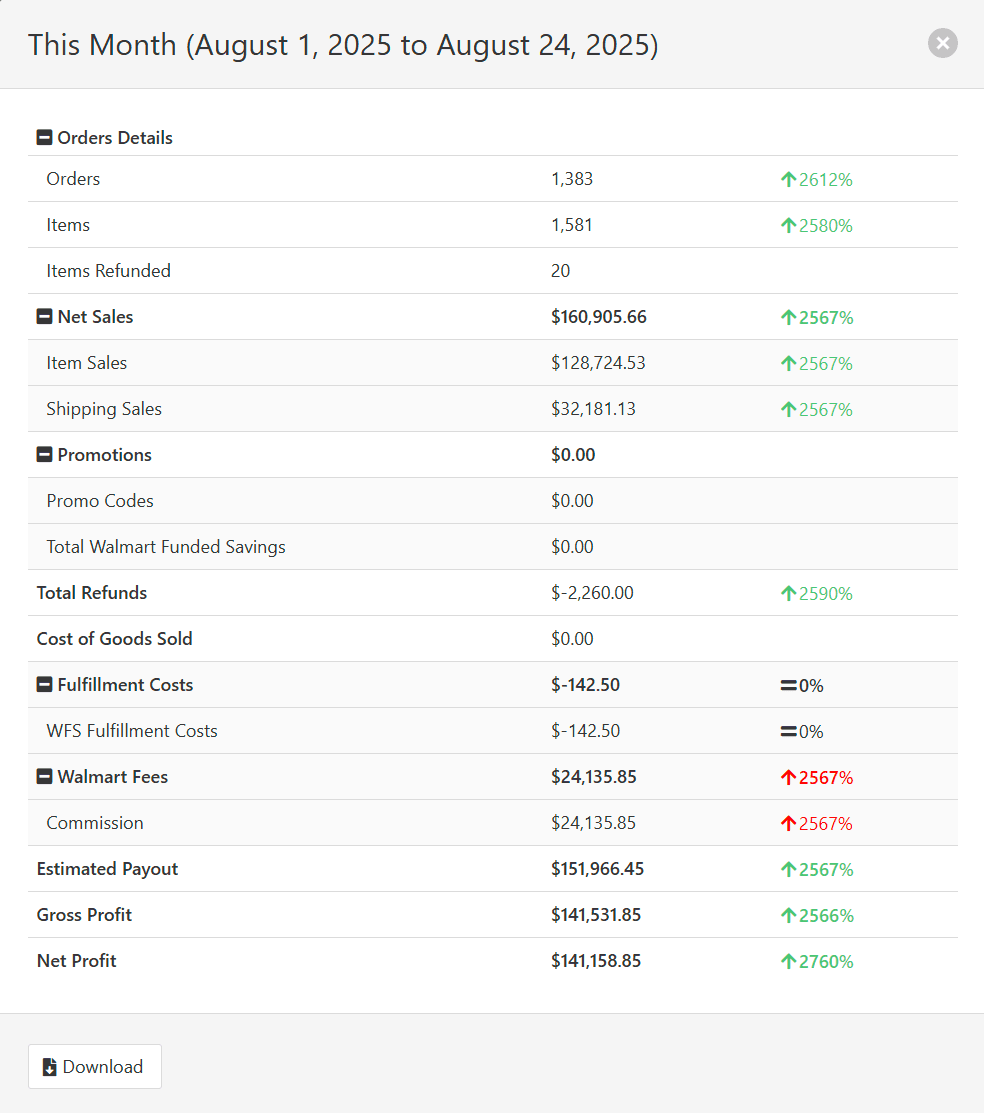
Sellegr8's Profit & Loss Dashboards give you instant clarity on your Walmart business performance – so you can stop guessing and start making smarter decisions based on real data.
Get Financial Visibility That Drives Growth
Tracking top-line sales isn't enough. You need to know what you actually keep. Sellegr8's P&L Dashboards break down your revenue, refunds, Walmart fees, ad spend, fulfillment cost and product performance to help you:
- Understand true profitability at a glance
- Spot issues by SKU, refund pattern, or order volume
- Forecast upcoming performance based on trends
- Identify low-performing products dragging down margins
Visual Dashboards for Smarter Decisions
Powerful analytics tools that turn complex data into actionable insights
Track Key Seller Metrics
Orders, units sold, refunds, ad spend, fees, revenue
Use Forecasting Tools
Predict monthly sales using our trend-based algorithm
Identify Refund Patterns
Filter by SKU to detect product issues and common return reasons
Slice by Product or Time Period
Zoom in on what matters most

Designed for Walmart Sellers
Sellegr8 pulls real-time data straight from your Walmart account and turns it into clean, actionable dashboards.
No more spreadsheets. No more second guessing.
- Real-time order and refund tracking
- Clean graphs that show what matters
- Built-in forecasting
- Product-level insights
Frequently Asked Questions about Walmart Profit & Loss Tracking
Everything you need to know about Sellegr8's P&L Dashboards
How do I track profits from my Walmart store?
Sellegr8's Profit & Loss Dashboards automatically track your revenue, refunds, and key seller metrics to show your true profitability – no spreadsheets required. Everything is pulled directly from your Walmart account in real time.
What metrics can I see in the Sellegr8 P&L dashboard?
You can view total sales, number of orders, units sold, product-level performance, refund counts, average order value, and projected monthly sales. All displayed in clean, easy-to-read graphs.
Can Sellegr8 help forecast my monthly Walmart sales?
Yes. Sellegr8 uses trend-based forecasting to predict your monthly sales based on past data. This helps you plan inventory, promotions, and growth targets more effectively.
Does Sellegr8 show product-level profitability?
Absolutely. You can break down profitability by SKU to identify top-performing products and those that may be draining your margins.
Why is profit tracking important for Walmart sellers?
Because revenue doesn't equal profit. Understanding your actual take-home margin helps you make better decisions on pricing, promotions, and inventory. Sellegr8 shows you the full picture so you can grow profitably.
See Your Business Clearly. Act Confidently.
Get the financial insights you need to grow profitably.
Proven tools
Transparent performance
Built exclusively for Walmart
Get the financial clarity you need to grow your Walmart business
Start making data-driven decisions with Sellegr8's powerful P&L dashboards.